Effects of subsidies and loans – the case study
In the previous three sections 3.2.1 – 3.2.3 three conventional models of financing were analysed – self-financing through energy savings, debt-financing and financing by EU funds and Operational Programmes.
Municipalities and region often combine all three together and following simple case study wants to show the way loans and subsidies, i.e. the most common external ways of financing of EE projects, have an effect on the financial sustainability and profitability.
For the purpose of our analysis, we consider a fictional EE project with investment costs 100.000 EUR into heat insulation and installation of FVE. This project generates annual energy savings 6.000 EUR as well as it has annual revenues from energy sales (FIT for instance) 4.000 EUR. There is 20 years project life-time period expected the same period is counted for the depreciation.42 The discount rate is 3%, the very low level which might be tenable just for the public sector.
The bank loan is calculated to be taken for 5 years with the interest rate 6%.
Taxes are not considered.
Putting the data to the table we get the following overview and if not stated otherwise, for all the graphs and tables in this chapter 3.2.4 following features of the case study are valid:
|
Input* |
Value |
|
Capital Costs |
€ 100 000,00 |
|
Annual Energy Savings + Annual Energy Revenues |
€ 10 000,00 |
|
Annual Operational Costs |
€ 3 200,00 |
|
Discount Rate |
3% |
|
Investment Lifetime Period |
20 years |
|
Depreciation Period |
20 years |
|
Bank Loan – Interest rate – Payoff period |
6% 5 years |
* For definitions consult the Chapter 5: Terms and definitions of this document
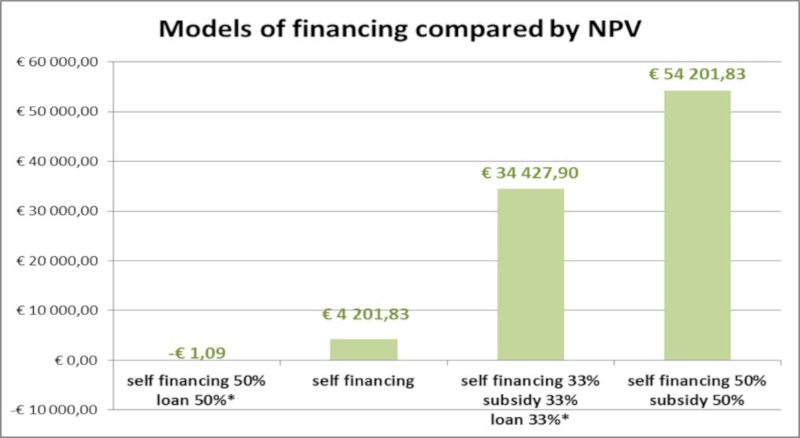
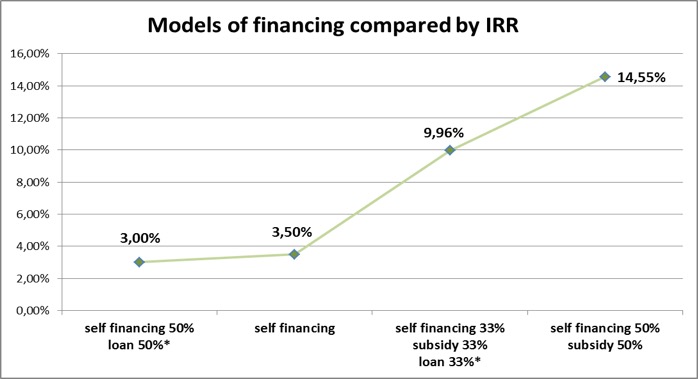
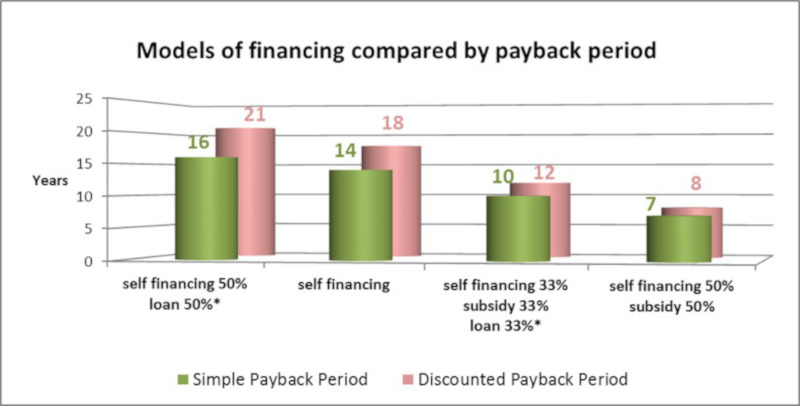
We will consider different share of loans and subsidies and analyse how they affect project profitability. After calculation of crucial indicators for each scenario we get following numbers*:
|
Indicator* |
Self-financing 50% |
Self-financing only |
Self-financing 33% |
Self-financing 50% |
|
Net Present Value (NPV) |
-€ 1,09 |
€ 4 201,83 |
€ 34 427,90 |
€ 54 201,83 |
|
Internal Rate Ratio (IRR) |
3,00% |
3,50% |
9,96% |
14,55% |
|
Simple Payback Period |
16 |
14 |
10 |
7 |
|
Discounted Payback Period |
21 |
18 |
12 |
8 |
* Consult the Chapter 5: Terms and definitions of this document
** Interest rate 6% for 5 years payoff period
Putting the data from the table above into the graphical form we can see even more clearly how particular indicators are influenced by the model of financing.
On this hypothetical case we can see that for instance with 50% loan this project would not be refundable, however, if we exchange the 50% loan for 50% subsidy, the dicounted payback period drops from 21 years to 8. Another interesting conclusion would be that the 100% self financing through energy savings is much less interesting for the investor than the situation with 33% loan, 33% subsidy and 33% own sources.
We can analyse this case further from other different perspectives. In the three following cases we will focus on the level of bank loan, level of subsidies and level of bank loan interest rate and how they particularly can change the profitability of the project.
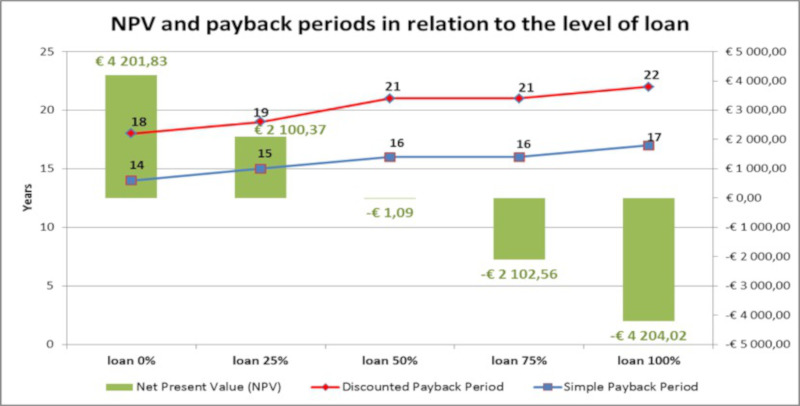
Level of the loan can change the final evaluation of EE project profitability considerably which is reflected in the following graph (loan interest rate is 6% for 5 years payoff period):
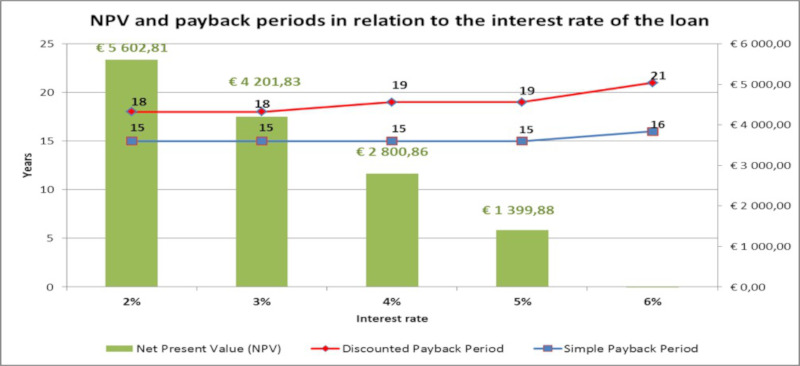
However, with taking the loan we still need to consider carefully the interest rate offered as this feature should have a huge effect on our decisions as indicated in the following graph where we consider different levels of interest rate for 5 years loan payoff period:
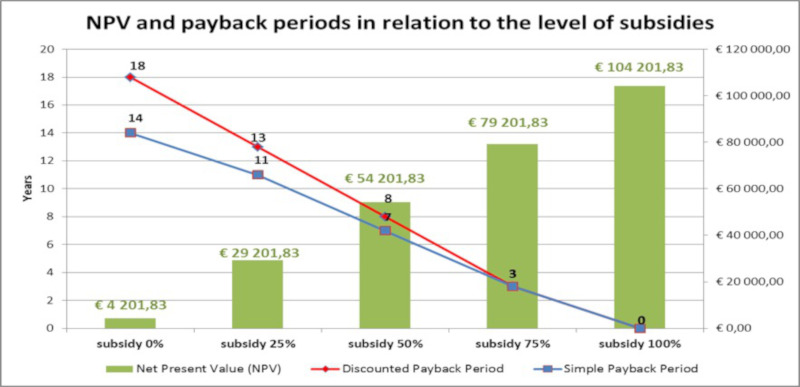
Finally, we can analyse effect of different levels of subsidies on the EE project profitability*:
Apparently, with increasing the level of subsidies all the financial indicators improve dramatically in a positive way. This is bringing stability, certainty and profitability to investors; on the other hand, excessive and prevailing utilisation of state and European interventions in a long term period can bring unhealthy dependency on this kind of support as well as unnatural barriers for the development of the local market with alternative financing instruments which are closely analysed in the following chapters 3.3 – 3.8.
* The NPV shows the same values for 100% self-financing (Picture 14) and 50% loan financing with loan interest rate 3% (Picture 15). The reason is the discount rate chosen for the calculation which is 3% as well. The difference between these two options is in the simple payback period, which is one year shorter when using just the self-financing without a loan.

